
This is the last in the series of data analysis from our Leadership Impact Assessment (LIA) data. This analysis is for Supervisors (11% of the population) and Managers (45% of the population). You can read the LIA overview and see all of the results at MeasuringLeadership.com. We cannot stress enough the importance of including some measure of accountability in your organization’s leadership training. Without a plan for an empirical, quantifiable and repeatable tool for measurement, an organization cannot track leadership progress or determine if the program is yielding an adequate return on investment.
“Without data you’re just another person with an opinion.”
– W. Edwards Deming, Data Scientist
This data is from people who have taken the assessment before one of our onsite or online leadership training programs through January 31, 2022.
In this article, we will examine results from the self-reported Supervisor and Manager level participants. We are covering them together because their results are very similar.

In this analysis, we find the Supervisors are below the population average on all nine dimensions. These leaders are not embracing or even knowing their innate qualities that will define their leadership potential. They are also not practicing any form of leadership process. Supervisors are still very early in their leadership career. They most likely performed well enough as a Manager and were promoted to Supervisor, with little regard for their leadership abilities. Organizations must recognize this critical point in their career and provide them with the leadership development support they need. Additionally, by using a tool such as the Leadership IMPACT Assessment, the organization can better assess how well they will perform as a leader going forward and identify areas for improvement.
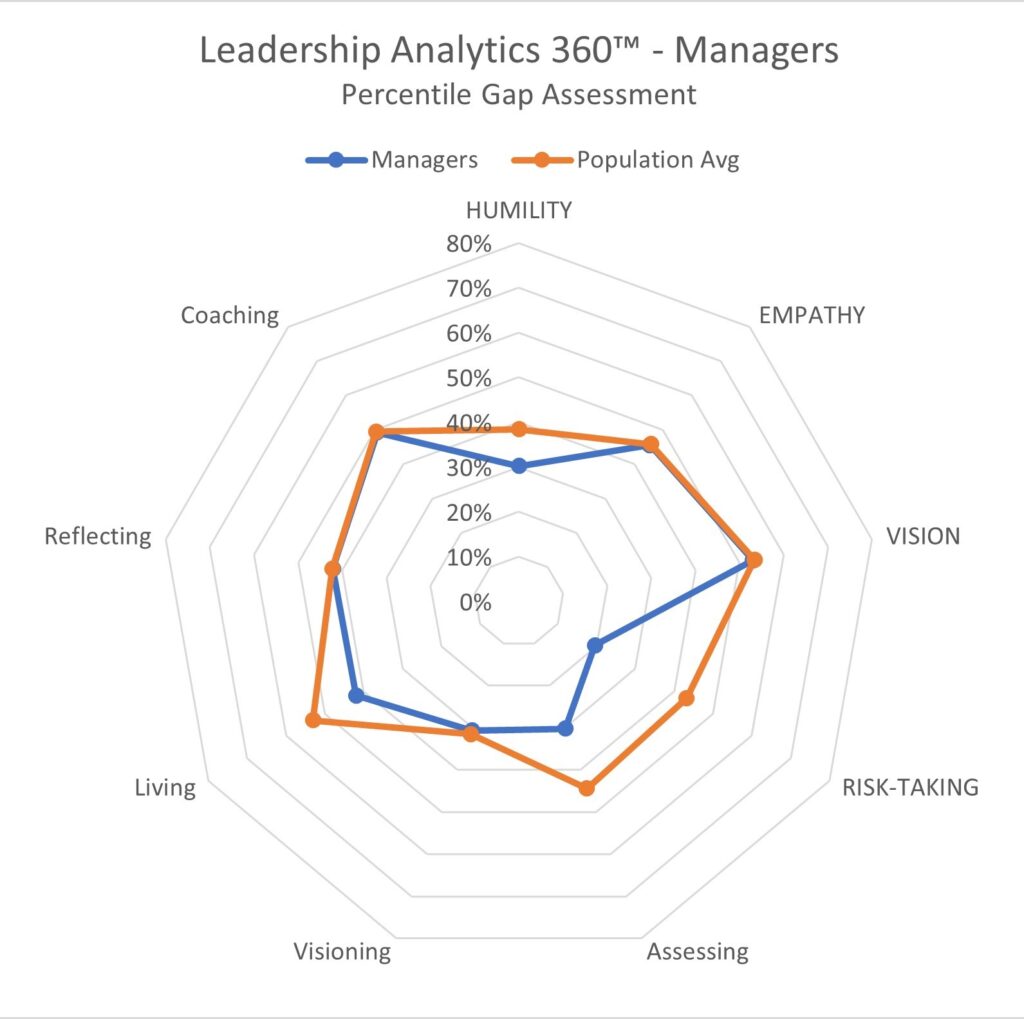
The Managers are also at or below the population average on all nine dimensions. Ironically, they are closer to the population average than the Supervisor level as indicated by the smaller gap between they score and the population average across all nine dimensions. This is probably because as new leaders they are very open to learning about being a good manager and there typically is some support in the organization from more senior leaders and peers to help them begin their leadership journey.
What do you believe could be the reason for the Supervisor and Manager results shown? Add your thoughts in the comments below.